This is an old revision of the document!
Table of Contents
LoRa Radio Coverage Test
Starting from September 2016, Saint-Joseph University of Beirut (USJ) will be deploying the first academic LoRa network in Lebanon. The network will support monitoring of micro-climate conditions in vineyards. Here below you can find the first radio coverage tests that enable to assess the basic performance of the LoRa technology.
-. Hardware Platform
The hardware platform consists of the following devices:
- Arduino Uno or Mega (x2) for 10 USD.
- Dragino shields (x2) for 20 USD.
- 868 MHz Antenna (x2) for 5 USD.
- OTG cable (x1) for 2 USD.
As shown in Fig. 1, the LoRa Dragino shields are plugged into the Arduino devices. The first combined module is connected to a computer with a USB A to B cable and will serve as a fixed base station as in Fig. 2. The second combined module is connected to a smartphone using an OTG cable and will serve as the mobile coverage tester.
-. Software Platform
For basic hands-on with the prototype devices, you can refer to the article Simple Prototype of LoRa Communications. Start by downloading the sketches that implement a reliable LoRa communication between the two modules: the client corresponds to the mobile device, the server to the base station. Open the sketches with Arduino IDE, compile and upload on the two arduino modules, respectively. The client will periodically send a hello message to the server and wait for an acknowledgement. Communication uses a spreading factor of 7 and a transmit power of 13 dBm. These parameters can be tuned as mentioned in the previous tutorial.
-. Base station
The software package on the base station is forked from https://github.com/p-v-o-s/rssi-map. On the computer of the base station, you should install python with scientific libraries (an easy way to do this is to download Anaconda) and the folium library for map visualization.
Anaconda is a data science platform including multiple useful python tools (scipy, numpy, networkx, …) that you can download from https://www.continuum.io/downloads.
Now, you can run the log.py script on the base station computer. This script reads data from the USB interface connected to the Arduino and outputs the received power in a CSV text file for each successful LoRa transmission. For the script to work, you should make sure to specify the adequate interface on your computer in the python source file. The following extract is valid for an Arduino Uno connected to Mac OS:
- log.py
ports = glob.glob("/dev/cu.wchusbserial1420")
The CSV log file will contain a timestamp and the received power in dBm given by the RSSI, separated by a comma.
- log1.csv
1475055879.107150,-44
1475055884.275906,-52
1475055889.444613,-60
1475055894.613355,-60
1475055899.782037,-65
1475055904.950378,-76
1475055910.119058,-71
1475055915.287805,-88
-. Mobile Device
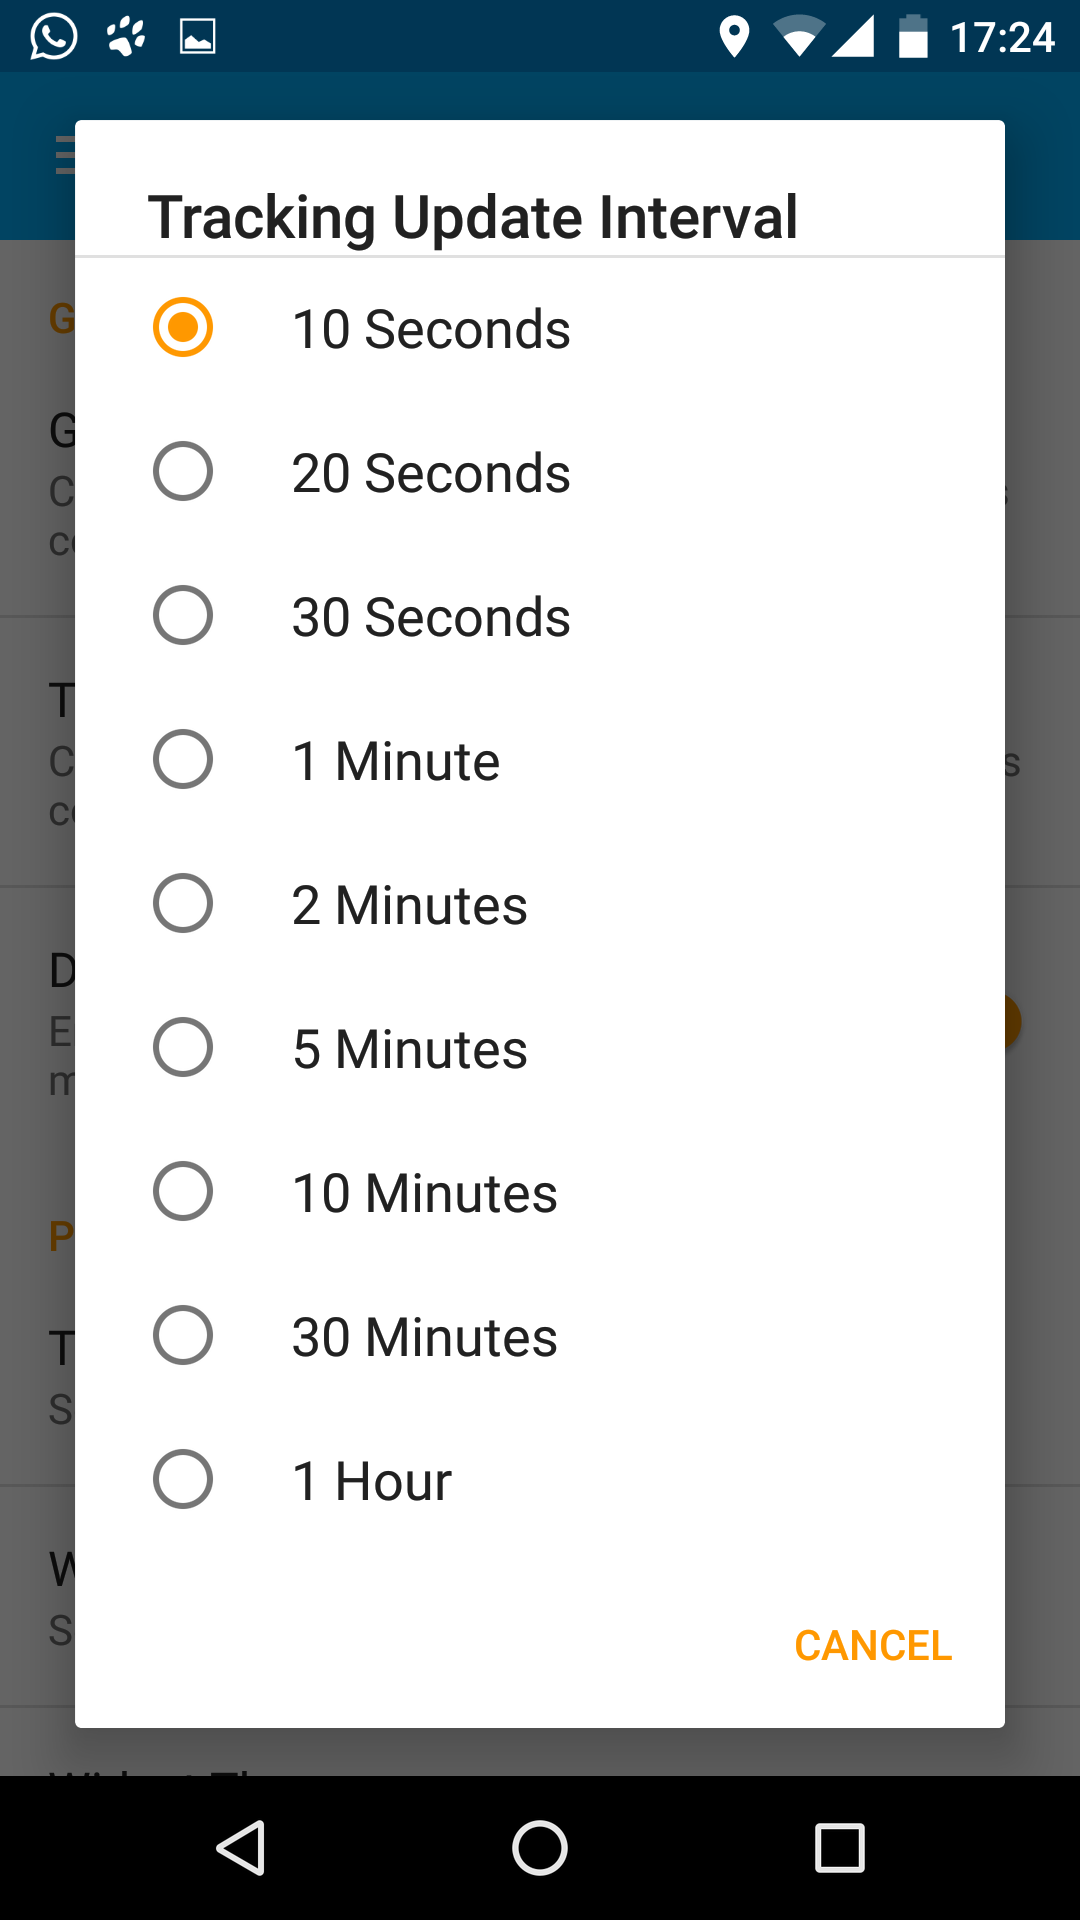
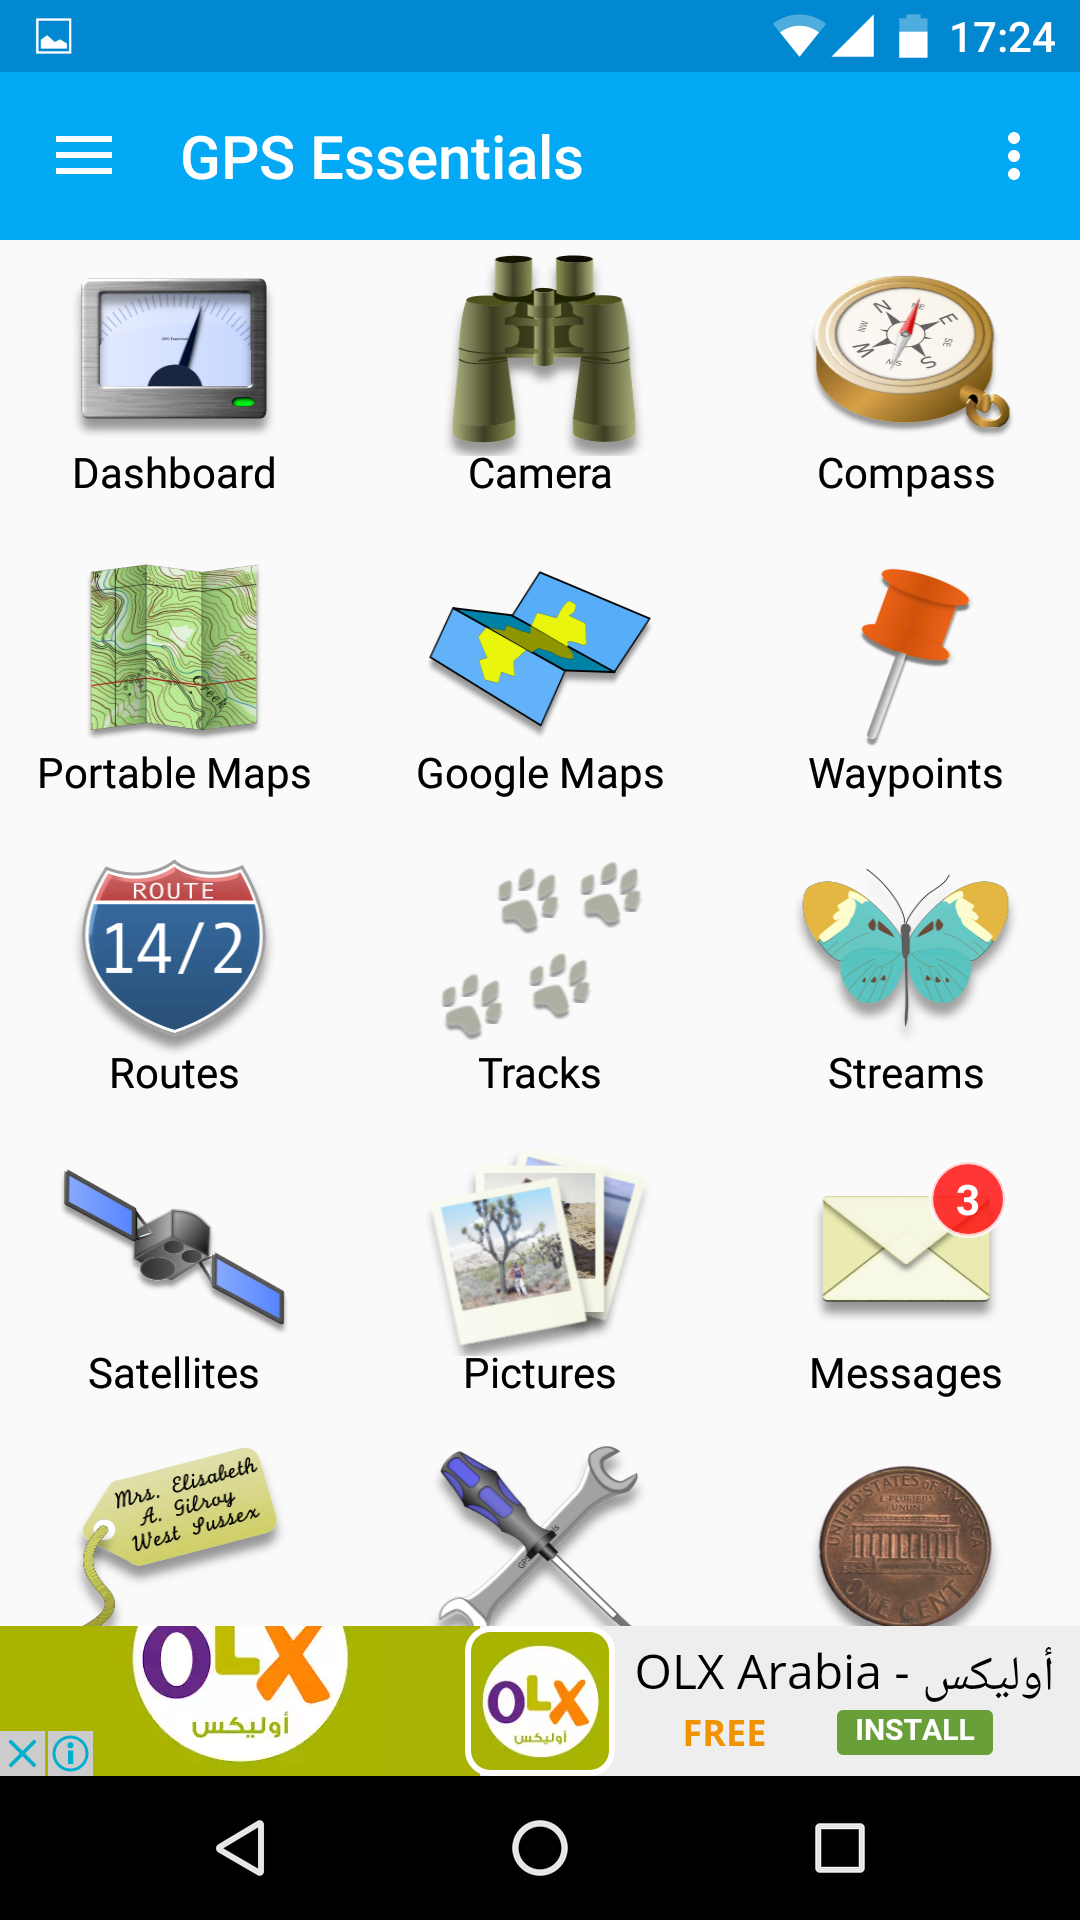
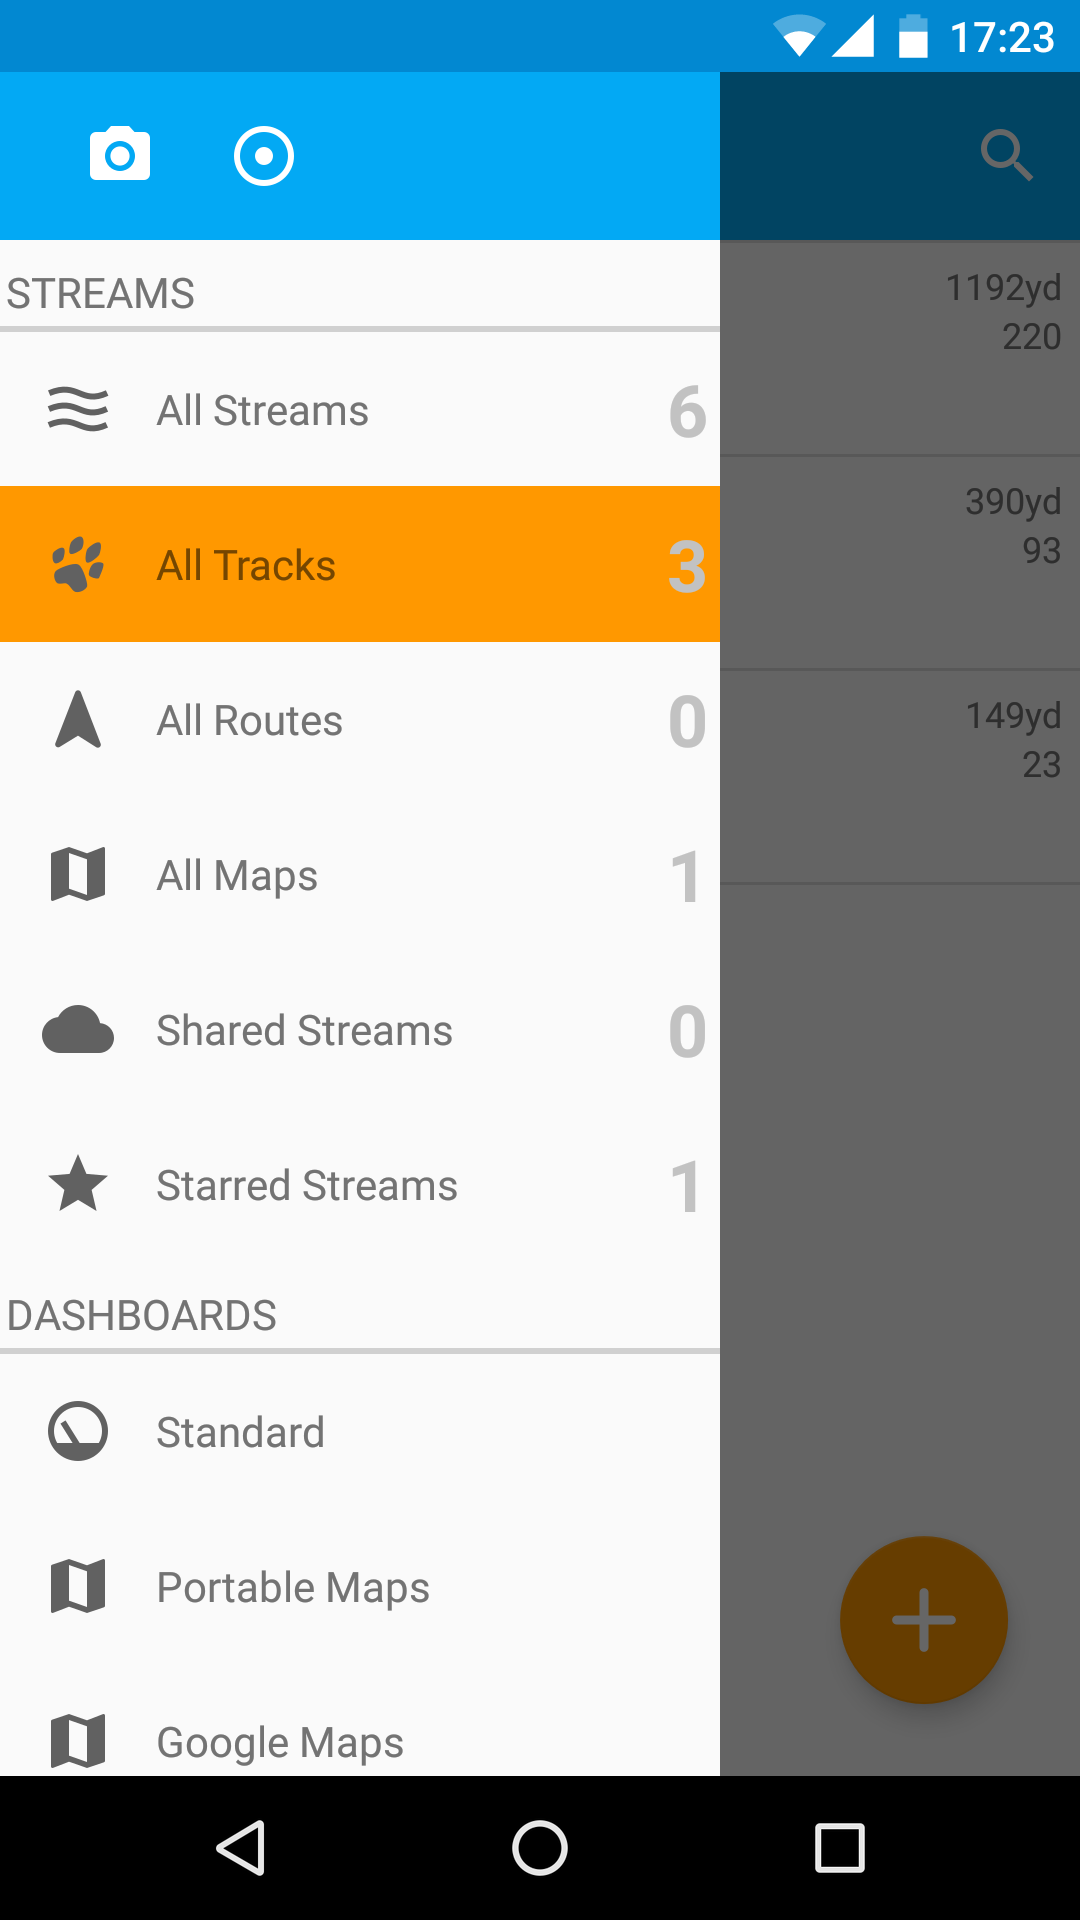
On the mobile device side, you should install and run GPS Essentials. This software is available for any android mobile platform and enables to track the mobile device by saving GPS coordinates in a XML file. Once installed, go to settings and fix the update interval to 10 seconds: this interval should be equal to the transmit interval of the LoRa devices. Now, you can launch a track as in the following screenshots and start your coverage testing walk.
-. Experiment Settings and Data Analysis
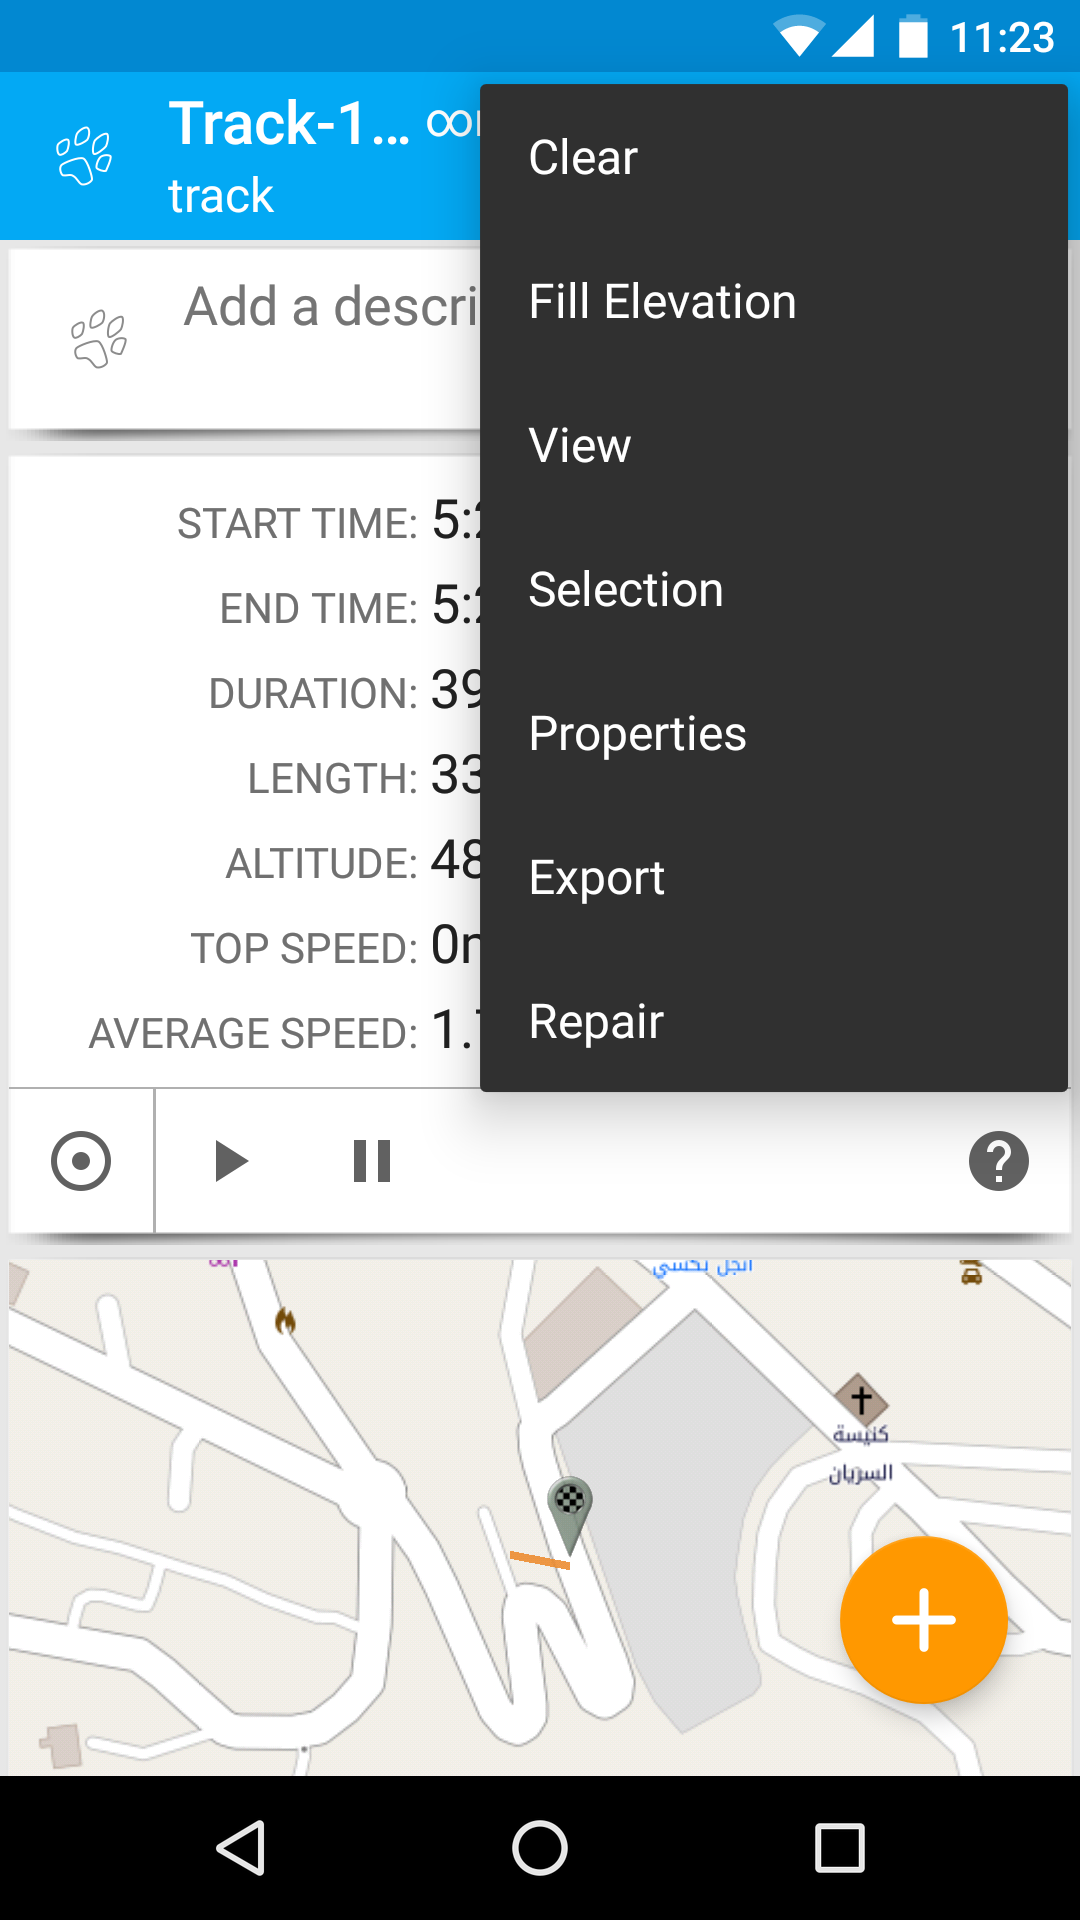
During the coverage test on the USJ CST campus, we placed the base station in a third floor classroom in one of the highest building of the campus. As mentioned before, the connected computer logs periodically timestamps and information on the received signal power. We carried the mobile device around the campus walking slowly so that the LoRa transmission and the GPS update can take place. After the end of the walk, GPS data can be exported form the GPS essentials application (as in the following screenshot).
Let us rename the obtained GPS file Track-160928-124332.gpx, and the log file on the base station Log-160928-124332.csv. Now, you can download the following scripts that enable to merge the data, analyse the communication, and output a coverage map.
Sort by transforming the GPX (XML GPS format) to CSV with the following command:
python gpx_to_csv.py ./data/Track-160928-124332.gpx
Then, merge the GPS data with the log file by perform time matching:
python timing_match.py ./data/Track-160928-124332.csv ./data/Log-160928-124332.csv
Finally, get some pretty vizualisation on a map:
python folium_plot_csv.py ./data/Track-160928-124332_GPS-RSSI.csv
-. Coverage Results
Figure 3 presents a typical output of the coverage test campaign. The base station is represented on the map. Green line represents good signal reception, while red line represents very weak signal identified for message drops between the client and the server.