Table of Contents
IoTLabs: Exploring LoRa Technology
As defined by Semtech, LoRa is a wireless technology developed to create the low-power, wide-area networks (LPWANs) required for machine-to-machine (M2M) and Internet of Things (IoT) applications. The technology offers a very compelling mix of long range, low power consumption and secure data transmission and is gaining significant traction in IoT networks being deployed by wireless network operators.
In this lab, you will implement a prototype of LoRa communication between two wireless devices. This enables you to get hands-on experience with LoRa, assess the radio performance, and prepare future advanced prototypes and experimentations.
- What are the advantages of the LoRa modulation?
- How LoRa is compatible with LPWAN requirements and constraints?
1. Setting the Lab
1.1 Hardware Platform
In order to design and implement experiments with LoRa, you will use the following devices:
- Arduino Mega or Arduino Duemilanove (x2).
- LoRa shields from Dragino (x2).
- Give the characteristics of the Arduino you are using: model, number of pins, type of pins, memory sizes, etc.
- Give the main characteristics of the LoRa shield from Dragino (www.dragino.com).
- What type of Antenna are you using? Explain the corresponding characteristics.
- Give an estimated cost of your devices.
1.2 Software Tools
Download the following software on your PC:
- RadioHead: The Packet Radio library for embedded microprocessors can be downloaded from https://github.com/samerlahoud/RadioHead.
- Arduino IDE: Specific OS versions can be downloaded from https://www.arduino.cc/en/Main/Software.
Unzip the RadioHead library and copy it to your sketchbook library folder as detailed in https://www.arduino.cc/en/Guide/Libraries.
Make sure to restart your computer after the installation of Arduino IDE and run the software as administrator.
1.3 Installation
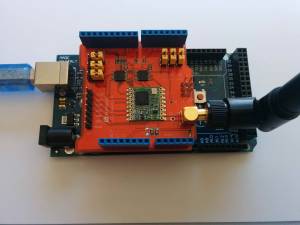
Start by plugging the Dragino shields on the Arduino devices and mounting the antennas as shown in Fig. 1.
Connect the two Arduino devices to USB ports on your computer. If this is the first time you use Arduino IDE, make sure to install the necessary USB drivers by selecting Tools > Boards Manager and installing Arduino AVR boards.
Now, you have to choose the Board type as Arduino/Genuino Mega 2560 or Arduino Duemilanove or Diecimilia in the Tools menu and select the corresponding serial Port to start programming your Arduino.
For Arduino Mega 2560, additional drivers for Microsoft Windows can be installed from http://wch.cn/download/CH341SER_ZIP.html. For Arduino Duemilanove, additional drivers can be installed from https://www.ftdichip.com/Drivers/CDM/CDM21228_Setup.zip
2. Theoretical Study
In this section, you will perform a theoretical assessment of the performance of LoRa modulation. You will later compare this theoretical results to the experimental ones as in a typical scientific study.
- What is the relation between processing gain and spreading factor in LoRa modulation?
- How does the spreading factor impact the coverage of a LoRa transmitter?
- What is the transmission bit rate for each of the following configurations of your LoRa device? Explain your computation.
- Configuration 1: channel bandwidth = 125 kHz, spreading factor = 7, coding rate = 4/5
- Configuration 2: channel bandwidth = 500 kHz, spreading factor = 7, coding rate = 4/5
- Configuration 3: channel bandwidth = 125 kHz, spreading factor = 12, coding rate = 1/2
- Compute the receiver sensitivity, assuming the following parameters: channel bandwidth = 125 kHz, spreading factor = 7, coding rate = 4/5, bit error rate (BER) target = 10-4, and receiver noise figure = 6 dB. Refer to this article to determine the mapping between the BER and the SNR.
- Compare the computed sensitivity to that provided by the Semtech Application Note AN1200.22 for the same parameters.
In the remainder of this lab, you will conduct measurements to validate the obtained theoretical receiver sensitivity.
3. Configuring and Running the Lab
3.1 Modifying the Radio Parameters
Download the basic sketches that implement a simple LoRa communication between two devices: a client and a server. Open the sketches with Arduino IDE (it is preferable to run Arduino IDE as administrator). Make sure to choose the correct Board and Port in the Tools menu.
Take a look at the source code in rf95_client.ino and rf95_server.ino. Particularly, the following extract from the setup function configures the radio parameters of your LoRa devices:
- Central frequency
- Spreading Factor
- Bandwidth
- Coding Rate
- Transmit power
rf95.setFrequency(frequency);
// Setup Power,dBm
rf95.setTxPower(13);

// Setup Spreading Factor (6 ~ 12)
rf95.setSpreadingFactor(7);

// Setup BandWidth, option: 7800,10400,15600,20800,31250,41700,62500,125000,250000,500000
//Lower BandWidth for longer distance.
rf95.setSignalBandwidth(125000);

// Setup Coding Rate:5(4/5),6(4/6),7(4/7),8(4/8)
rf95.setCodingRate4(5);
In order to reduce collisions between simultaneous experiments, configure the central frequency of your LoRa devices as indicated below:
| Group Number | Frequency |
|---|---|
| 1 | 866.7 |
| 2 | 866.9 |
| 3 | 867.1 |
| 4 | 867.3 |
| 5 | 867.5 |
| 6 | 867.7 |
| 7 | 867.9 |
| 8 | 868.1 |
| 9 | 868.3 |
| 10 | 868.5 |
| 11 | 868.7 |
| 12 | 868.9 |
3.2 Running Basic Sketches
Now you can compile and upload the client and server sketches on the two arduino devices, respectively. On the serial interfaces, you should obtain similar results as in Fig. 2 and Fig. 3. The client sends periodically a short packet towards the server. The server outputs the RSSI (received power in dBm) for each received packet.


4. Performance Evaluation
In the following, you will design and implement a set of scenarios that enable to evaluate the performance of the LoRa modulation. As you will deal with scientific assessment, you are required to use scientific tools to show the results. You have the choice between gnuplot, matplotlib with Python, and MATLAB. Take some time to become familiar with one of these software as you will be required to use them in different occasions of your academic programme.
As we are in presence of variable radio conditions, some experiments should be repeated multiple times and results can be shown as probability distributions. Take a look at this excellent repository of data visualisation tools https://www.data-to-viz.com.
4.1 Time on Air
In this section, you will measure the Time on Air (ToA) that is given by the time necessary to transmit a packet on the radio interface. You will assess the impact of the spreading factor, bandwidth, coding rate, and packet size on the ToA.
Start by implementing a function on the client that measures the time necessary for sending a packet. You can have recourse to the micros() function available in the arduino libraries. Now, you can modify one of the parameters (spreading factor, bandwidth, coding rate, packet size) and record the impact on the ToA. Note well that you may need to repeat the experiment multiple times in order to obtain the statistical distribution.
For example, the scenario for assessing the impact of the spreading factor on the ToA consists of sending 100 packets for three different spreading factors e.g., 7, 9, and 10, and drawing the average ToA or the distribution in a boxplot for comparing the results.
As for the theoretical computation of the ToA, you can refer to the the following documents :
- The Semtech specification (section 4.1.1.6)
- An explanatory video: https://www.youtube.com/watch?v=C_Rh5GSENA4
- Various calculation tools available online: https://www.loratools.nl/#/airtime, Spreadsheet
Note that all messages sent and received by the RH_RF95 RadioHead driver we are using conform to this packet format:
- 8 symbol PREAMBLE
- Explicit header with header CRC (handled internally by the radio)
- 4 octets HEADER: (TO, FROM, ID, FLAGS)
- 0 to 251 octets DATA
- CRC (handled internally by the radio)
- Describe the scenarios you used for assessing the impact of the different parameters on the ToA.
- Join commented extracts of your code and raw data in attached files.
- Visualise the experimental results by plotting the ToA as a function of each one of the different parameters.
- Analyze the obtained results and compare with the theoretical computations. You can superpose the theoretical results and the experimental ones on the same graph.
4.2 Collisions and Packet Delivery Ratio
In this section, you will compute the impact of the packet arrival rate on the collision rate and consequently the Packet Delivery Ratio (PDR).
Let us consider an ALOHA model for the random access in a LoRaWAN network.
- What are the advantages of a random access in a wireless IoT context? What are the shortcomings?
Suppose that the packet length is 50 bytes.
- What is the maximum packet generation rate for each spreading factor (SF7 to SF12)? Explain your answer.
In the following we consider N devices transmitting 50 bytes packets using SF7. The packet generation rate is assumed to be equal to the maximum possible rate given the duty cycle limitation.
- Compute the number of successful transmissions per hour for 50, 100, and 200 devices respectively. Comment the obtained results.
- Plot the number of successful transmissions per hour as a function of the number of devices for SF7 and SF12. Analyse the obtained figure and attach the simulation code.
- Plot the packet delivery ratio as a function of the number of devices for different SFs. Give the details of your computation and the simulation code.
- Plot the number of successful transmissions per hour per device as a function of the number of generated packets per hour per device for 20 and for 100 devices. Note well the duty cycle limitation.
5. Coverage Challenge
Start by identifying a set of three geographical locations or Test Points (TP). These TPs should be astutely chosen to explore the limits of LoRa coverage. Then, you should implement a function on the server that measures the ratio of successfully delivered packets or PDR (Packet Delivery Ratio). Now, you should run the experiment for three different radio configurations: such configurations should provide different reliability levels (high, medium, and low reliability).
- Draw the test points on a map and motivate your choices.
- Describe the radio configurations you selected and their impact on the reliability of the transmission.
- Visualise the experimental results by plotting the PDR for each TP and each radio configuration.
- Analyze the obtained results.
You are now required to establish a record of LoRa coverage. You can certainly unleash your scientific imagination, but some rules must be followed to validate the record:
- Direct transmission between the two devices is only considered.
- 3D distance is computed between devices radiofresnel.
- PDR must be higher than 10% as computed for 100 packets.
- Supporting live video and screen capture should be used to authenticate the record.
You can use Cloud RF or Radio Mobile online service to obtain information on the elevation, Fresnel zone radiofresnel, and estimated path loss.
- Compute the Fresnel zone for your transmission. Comment the result.
- Provide the expression of the link budget and compute the received power using two different path loss models (ITM, Line of sight) with Cloud RF.
- Compare the received power obtained experimentally with the results of the online simulators.
- Prepare a short presentation (5 minutes pitch) to describe your experiment.
This challenge and the corresponding grading is considered as a part of the final project.
6. Grading
| Exemplary | Accomplished | Developing | Beginning | |
|---|---|---|---|---|
| Techniques for Engineering Practice | Students showed proper and justified use of techniques necessary for engineering practice (such as numerical methods, stochastic processes, statistical analysis, etc.). | Students used techniques necessary for engineering practice without justification (such as numerical methods, stochastic processes, statistical analysis, etc.). | Students improperly used some techniques necessary for engineering practice (such as numerical methods, stochastic processes, statistical analysis, etc.). | Students improperly used some techniques necessary for engineering practice (such as numerical methods, stochastic processes, statistical analysis, etc.). |
| Skills for Engineering Practice | Students showed advanced skills necessary for engineering practice (such as programming, drawing and manipulating equipment). | Students showed skills necessary for engineering practice of the Labs (such as programming, drawing and manipulating equipment). | Students showed limited skills necessary for engineering practice (such as programming, drawing and manipulating equipment). | Students showed no skills necessary for engineering practice (such as programming, drawing and manipulating equipment). |
| Engineering tools | Students showed advanced ability to properly use modern engineering tools that are necessary for the Labs, such as simulators, software or computer tools. | Students showed limited use of modern engineering tools that are necessary for the Labs, such as simulators, software or computer tools. | Students showed improper use of modern engineering tools that are necessary for the Labs, such as simulators, software or computer tools. | Students showed no use of modern engineering tools that are necessary for the Labs, such as simulators, software or computer tools. |
| Problem solving | Students solved an engineering problem by choosing appropriate tools and applying engineering skills with proper justification. | Students solved an engineering problem by choosing appropriate tools and applying engineering skills. | Students solved an engineering problem but tools were not appropriate and engineering skills not applied. | Students did not solve the engineering problem. |
| Results and analysis | Students presented the Labs results and performed analysis, assessment, and comparison with theoretical results. | Students presented the Labs results and performed analysis and assessment. | Students presented the Labs results without analysis. | Students did not present the Labs results. |
| Motivation, initiative, and creativity | Students were motivated during the Labs. They took initiative, made their own decisions, and came up with new and creative ideas, propositions, and solutions. | Students showed motivation for their Labs. They were able to take initiatives to make their work advance. | Students showed little/unstable motivation. Little initiative has been taken. | Students were passive with no motivation. They did not take any initiative in their work. |
| Written communication skills | Students provided an organized and thouroughly proof-read document with appropriate structure and formatting (figure labels, headings, references, graphs, etc.), and relevant semantics. | Students provided an organized document with appropriate structure, and relevant semantics, containing minor misspellings and/or grammatical errors. | Students provided a document with appropriate structure, and poor semantics, containing minor misspellings and/or grammatical errors. | Students provided a document with inappropriate structure and formatting, and poor semantics, containing major misspellings and/or grammatical errors. |
| Scientific referencing | Original work. Proper referencing of material (parts/sentences/figures) quoted from relevant sources. | Original work. Proper referencing of material (parts/sentences/figures). | Proper referencing of quoted material (parts/sentences/figures) but over-reliance on external sources. | All copied material (parts/sentences/figures) from other sources is not referenced. Reports cannot be submitted as is and must be rewritten. |