Cellular Network Map
Real deployment data for cellular networks can be very convenient when elaborating simulation scenarios in scientific papers. In the following, we present an automation tool that enables to extract the geographical data of the base stations for the mobile operators in France.
You need a working python distribution with the following packages:
You also need to have a valid subscription on the ANFR (Agence Nationale des Fréquences) website.
1. Download or fork my repository from GitHub.
2. Launch the crawler script from your command line. The argument of the script corresponds to the French postal code as in:
python antennes-mobiles-crawler.py 75014
You should obtain a text file named network-map-75014.txt in the /data directory. This file contains information on the antennas in the considered area.
66007; 2G 3G 4G; BOUYGUES TELECOM; 1995-09-01; 2014-09-26; 156 R LÉON MAURICE NORDMANN; 75013; PARIS-13E--ARRONDISSEMENT; Oui;
351124; 2G 3G 4G; BOUYGUES TELECOM; 2004-08-20; 2014-12-05; 22/24 R DU FAUBOURG ST JACQUES; 75014; PARIS-14E--ARRONDISSEMENT; Oui;
The only missing information is the exact geographic position of the antennas. For this, you need data from ANFR.
3. Go to ANFR, select the same postal code as previously and download the data (you should sign in and you will receive data by mail). Put the obtained data in data/cartoradio-75014/.
4. Launch the coordinate generation script:
python antenna-coordinate-generation.py 75014 orange 4G
- The first argument is the postal code.
- The second argument is the operator name: orange - free - bouygues - sfr.
- The last argument is the network type: 2G - 3G - 4G.
5. Watch back and enjoy!
The output of the automation tool consists of three files:
- A command file
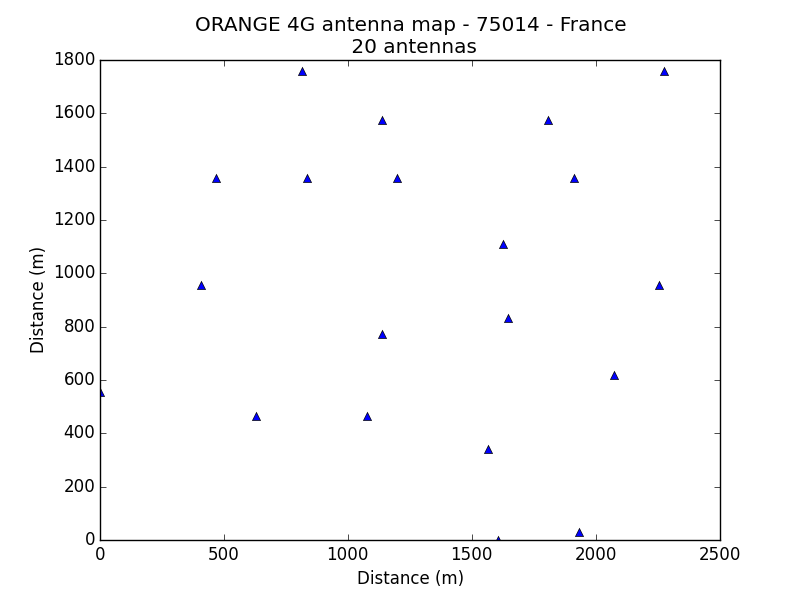
75014_ORANGE_4G_antenna_coordinates.mthat contains the coordinates of the antennas. You can simply load this file in MATLAB for your simulations. - A figure plot of the antenna positions
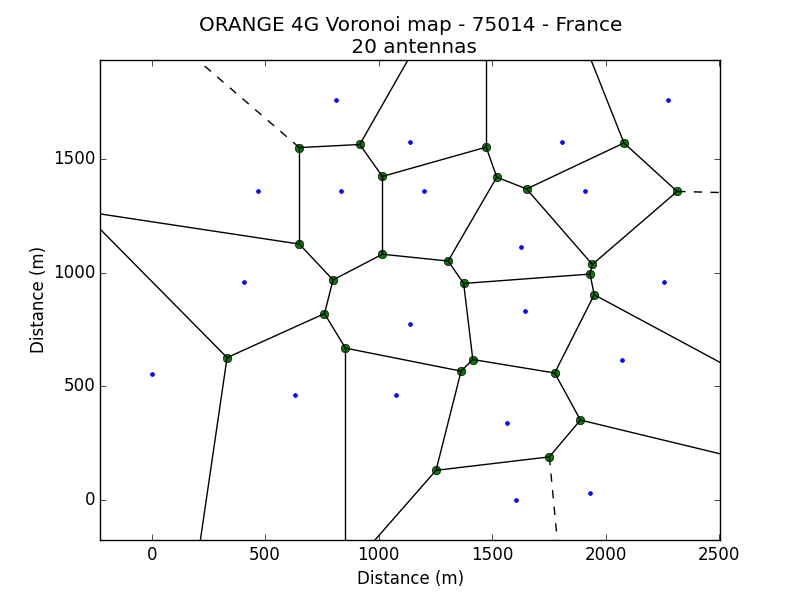
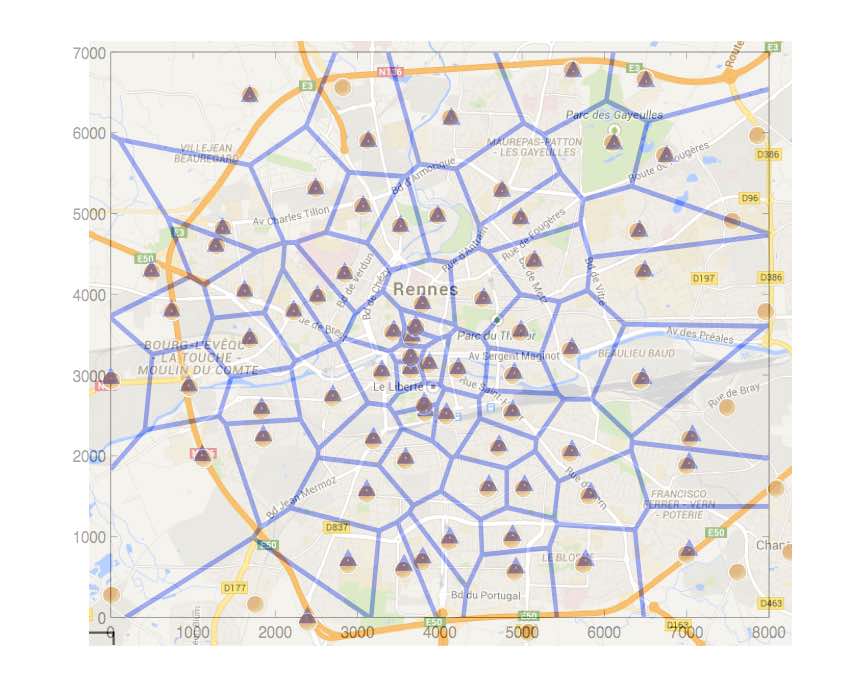
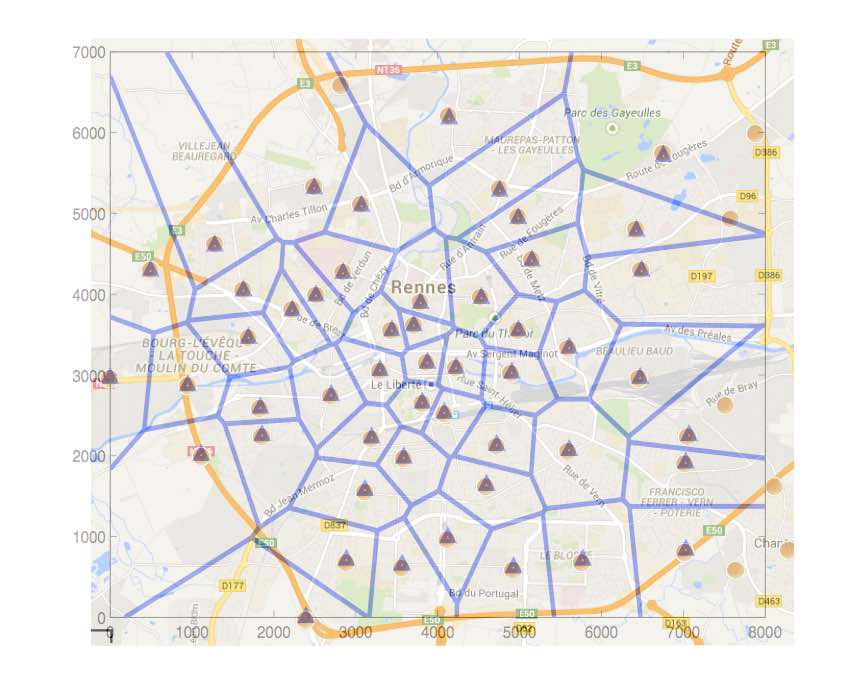
75014-ORANGE-4G-antenna-map.png. - A figure plot of the Voronoi diagram (the set of points in the geographic area closer to each antenna)
75014-ORANGE-4G-voronoi-map.png.
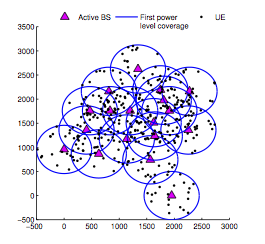
We used the antenna positions generated by the automation tool in our work entitled Joint Power-Delay Minimization in 4G Wireless Networks (by Farah Moety, Samer Lahoud, Bernard Cousin, and Kinda Khawam), published in the proceedings of the Wireless Days conference (WD'14) in 2014. In this scientific work, we propose an algorithm that computes the transmit power level of the network Base Stations (BSs) and associate users with these BSs. The objective is to jointly minimise the total network power and the total network delay. In the following figure, we show the coverage area of each BS when transmitting at the lowest power level and the user distribution in the studied area.
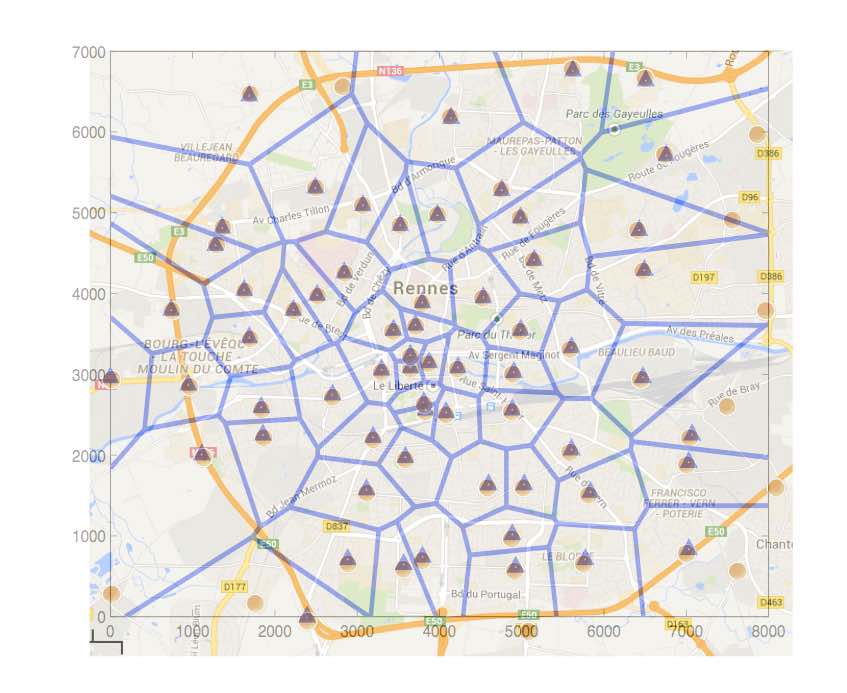
The automation tool can be used in different scenarios. For instance, in order to illustrate the densification of the network deployment, a comparative study can be performed on the 2G, 3G, and 4G networks. The case of the city of Rennes is presented hereafter.
If you want to perform your own computations based on typical examples, you can download the coordinates of the antennas for the different mobile operators in Rennes and Paris.
Example data is based on ANFR and www.antennesmobiles.fr. I care about software sharing improvements (GPLv3). If you use the above examples, you can cite our work as in WD'14.